
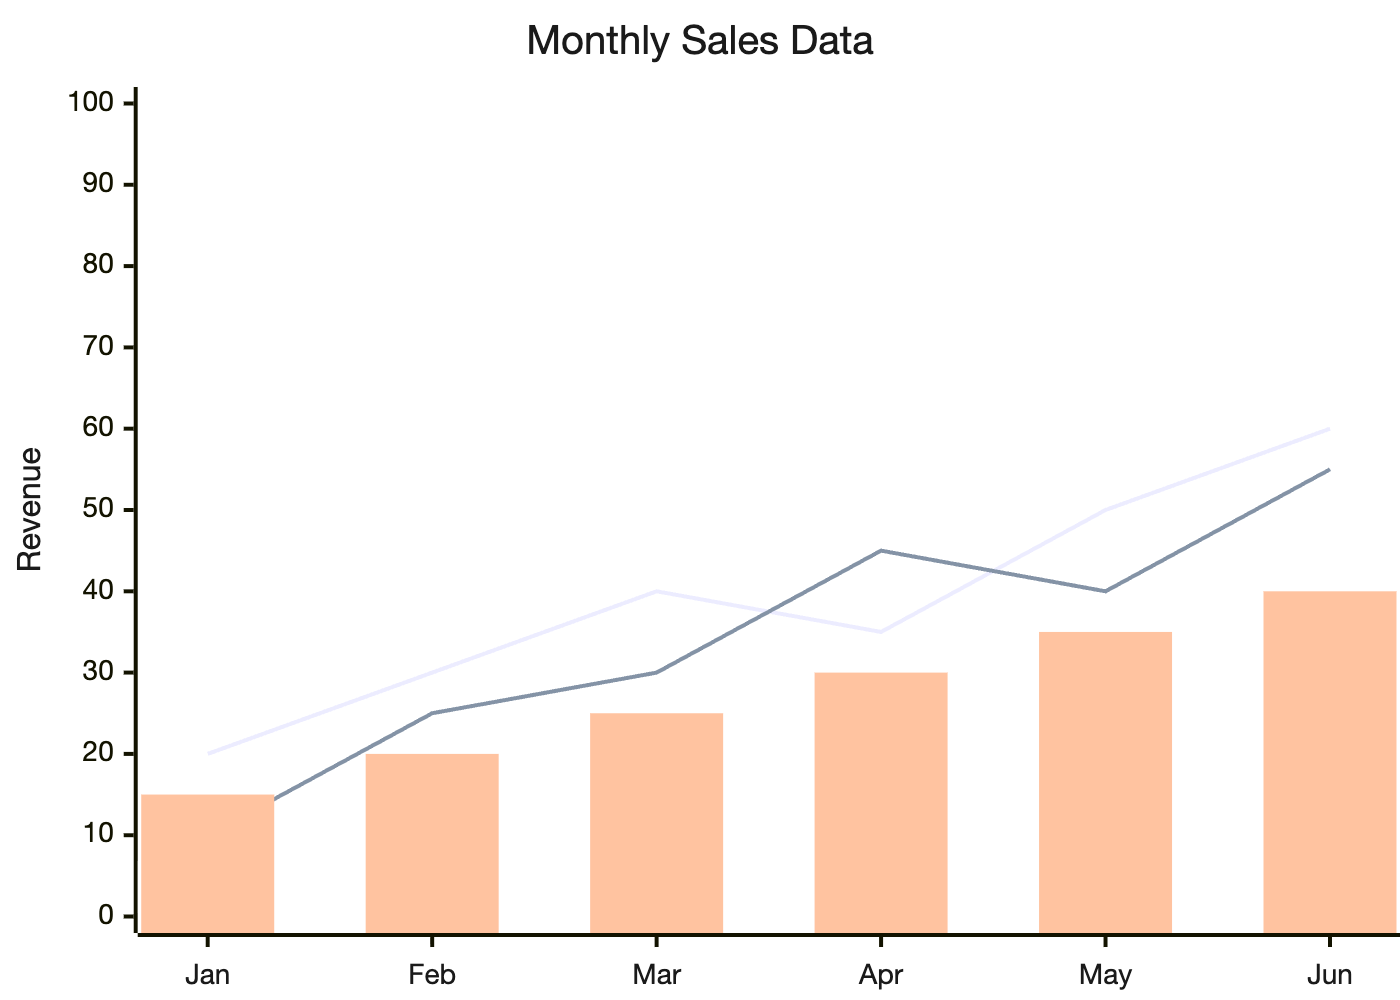
Generate XY Charts with AI
Transform your data into professional XY charts using AI. Describe your data points, and our AI will generate beautiful line charts, bar charts, and scatter plots instantly.
Create Beautiful Mermaid Online Diagrams from Text
Transform your ideas into visual diagrams using simple Mermaid syntax. Perfect for documentation, system design, and workflow visualization.
- Choose a template from the left panel or write your own Mermaid syntax
- Watch your diagram render automatically in the preview panel
- Use the export buttons to download your diagram as SVG or PNG
- Click copy buttons to copy the diagram to your clipboard
- For custom diagrams, refer to the Mermaid documentation for syntax helpMermaid documentation for syntax help
What is AI XY Chart Generator
AI XY Chart Generator is an intelligent tool that transforms natural language data descriptions into professional XY charts. Perfect for data analysts, business professionals, and researchers.
- AI-Powered Data VisualizationDescribe your data in plain language, and AI generates accurate line charts, bar charts, and combination charts.
- Multiple Chart TypesSupport for line charts, bar charts, scatter plots, and combination charts with multiple data series.
- Professional QualityGenerate publication-ready charts with proper axes, labels, legends, and professional styling.
Why Choose Our AI XY Chart Generator
Intelligent AI-powered XY chart generation service that ensures clear, professional data visualization.
How to Use AI XY Chart Generator
Create professional XY charts in three simple steps:
Core Features of AI XY Chart Generator
Advanced AI-powered features designed specifically for XY chart and data visualization generation.
Natural Language Input
Describe your data in plain English - no need to format spreadsheets or learn charting syntax.
Smart Data Parsing
AI automatically extracts X-axis labels, Y-axis values, and multiple data series from your description.
Auto-Scale Detection
AI intelligently determines appropriate axis scales, ranges, and intervals for optimal data visualization.
Multi-Series Support
Generate charts with multiple data series, comparison lines, and trend indicators.
Mermaid Online Diagram Generation Price Plans
Choose the perfect Mermaid chart generation plan that suits your needs. Create professional flowcharts, sequence diagrams and more at affordable prices.
Basic One-time
Pay once for 1000 credits.
- Export to PNG/SVG
- 100 Diagram Storage limit
- 1000 Credits Total
- Up to 500 times AI Mermaid Optimization
- Up to 500 times AI Mermaid Generation
Standard One-time
Pay once for 20000 credits.
- Export to PNG/SVG
- No Watermark Export
- 20000 Credits Total
- 10000 times AI Mermaid Optimization
- 10000 times AI Mermaid Generation
Monthly Basic Package
Monthly access to 1000 credits.
- Export to PNG/SVG
- 100 Diagram Storage limit
- 1000 Credits Total
- Up to 500 times AI Mermaid Optimization
- Up to 500 times AI Mermaid Generation
Frequently Asked Questions About AI XY Chart Generator
Common questions and answers about our AI-powered XY chart generation tool.
What is an XY chart?
An XY chart (or Cartesian chart) plots data points on a two-dimensional grid with X and Y axes. Common types include line charts for trends, bar charts for comparisons, and scatter plots for correlations.
Can I create charts with multiple data series?
Yes! You can describe multiple data series in your natural language input, and the AI will generate charts with multiple lines, bars, or combination visualizations with proper legends.
What chart types does the AI support?
The AI can generate line charts (for trends over time), bar charts (for comparisons), scatter plots (for correlations), and combination charts mixing different visualization types.
Can I use these charts in my publications?
Absolutely. All XY charts generated by our AI tool are free to use in business reports, academic papers, presentations, and any commercial or non-commercial projects.
Start Generating XY Charts with AI Today
Transform your data into professional XY charts in seconds with our AI-powered tool.