Mermaid Tutorials for Every Diagram Type
Learn each Mermaid syntax family with practical examples, clear decision guidance, production checklists, and copy-ready starter diagrams.
Start with the essentials
Popular tutorial paths for docs, product flows, and architecture notes.
Browse Tutorials
Pick a diagram type, learn the syntax surface, and move from a small valid example to a publishable diagram.
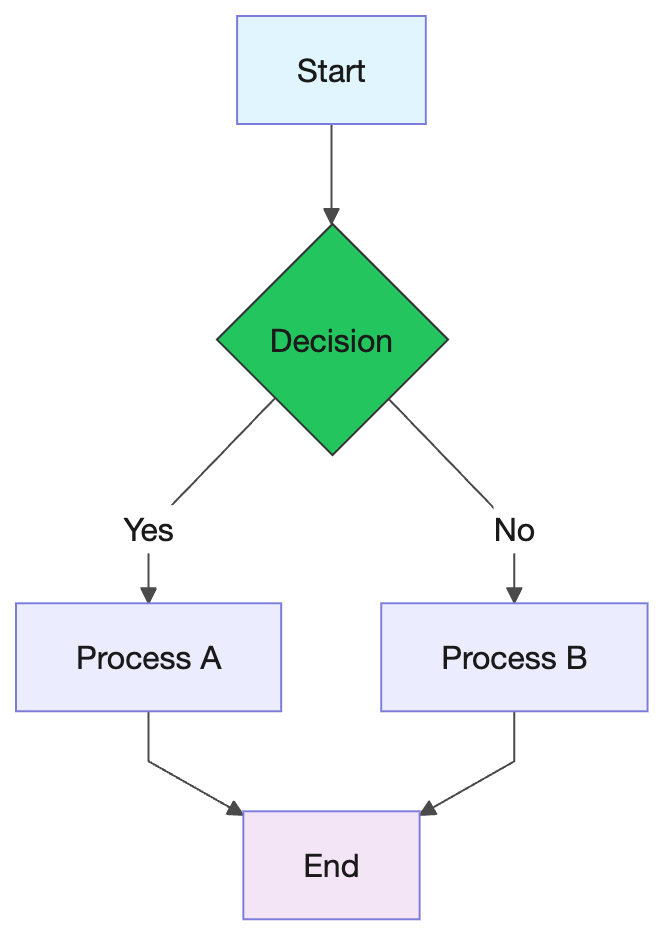
Flowchart
Flowcharts turn decisions, processes, and branches into readable Mermaid diagrams. They are the best starting point when you need to document a workflow, product funnel, or engineering process.
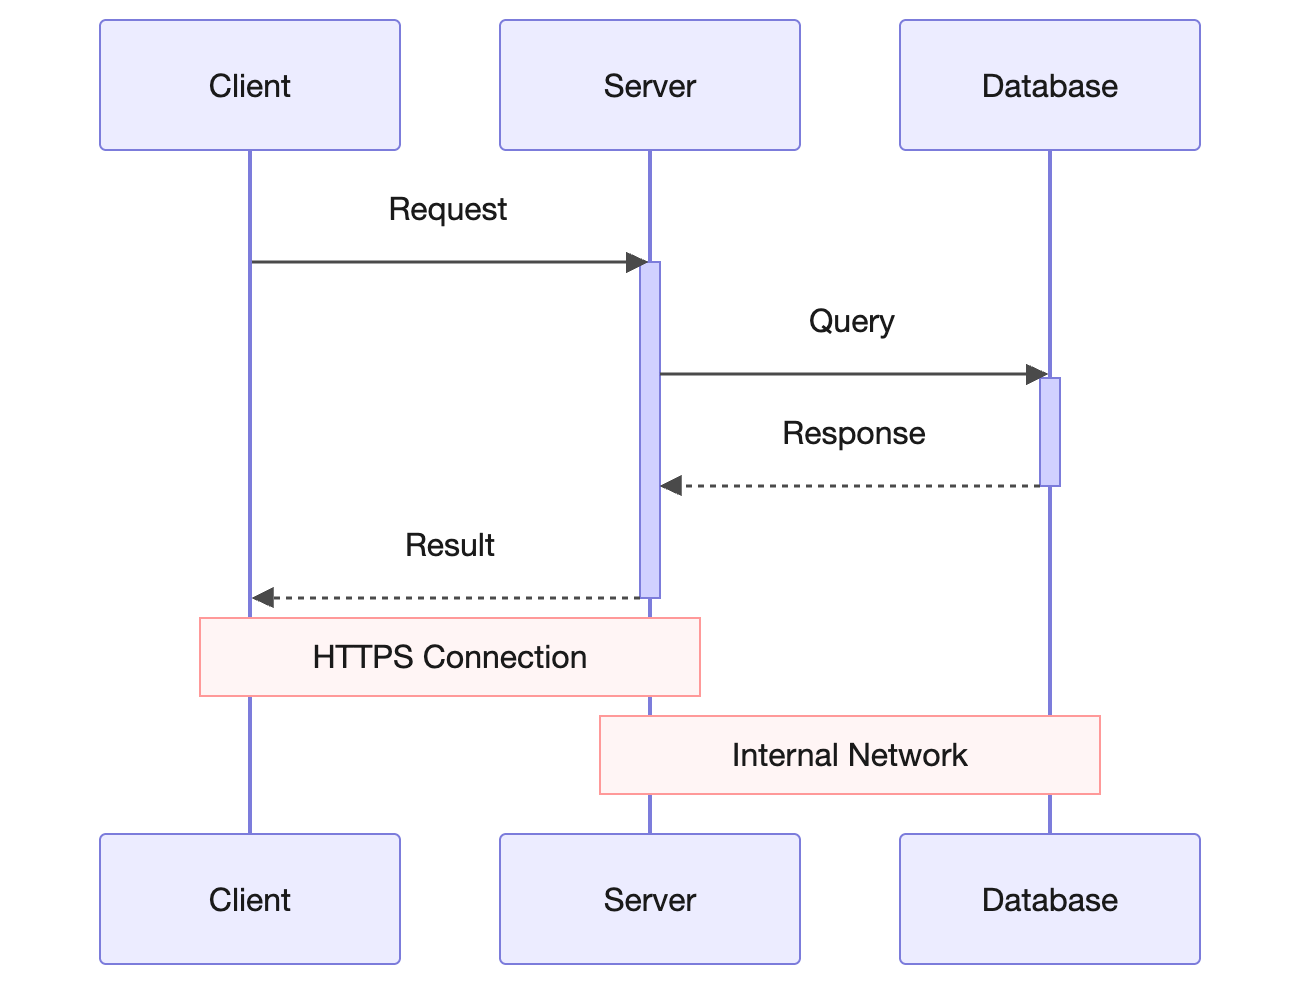
Sequence Diagram
Sequence diagrams show how participants communicate over time. Use them when the order of messages matters more than the internal structure of each system.
Swimlanes
Swimlane-style Mermaid diagrams separate responsibilities across teams, systems, or roles. They are useful when a process moves through multiple owners.
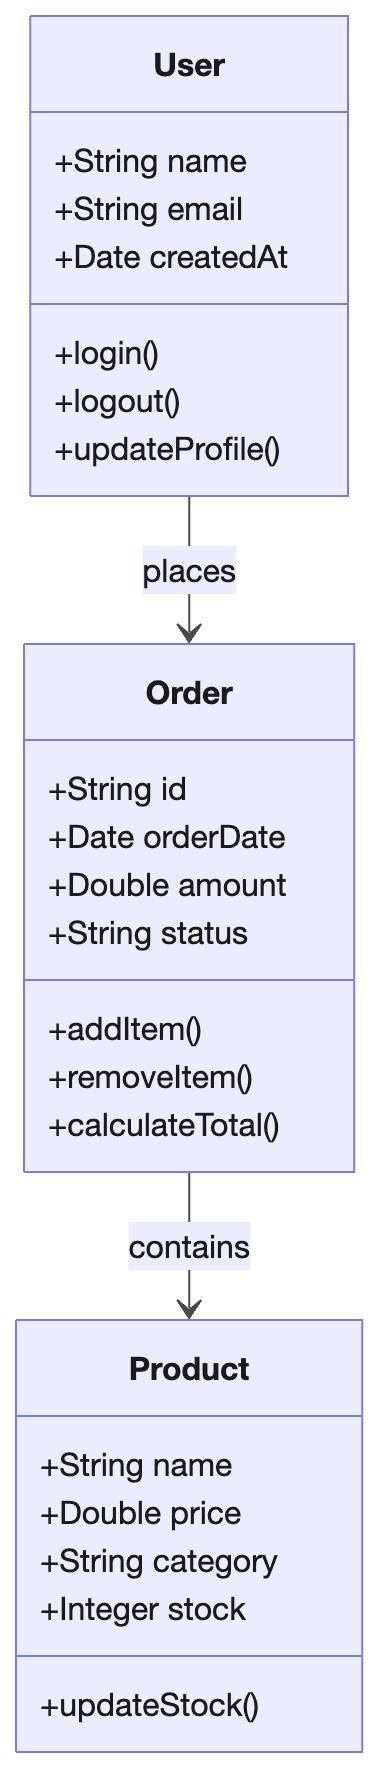
Class Diagram
Class diagrams describe object models, relationships, methods, and attributes. They are useful for documenting domain models and object-oriented design.
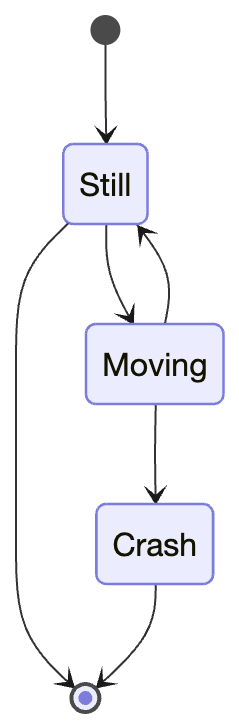
State Diagram
State diagrams explain how an object, workflow, or UI moves between states. Use them when transitions and allowed events are the key information.
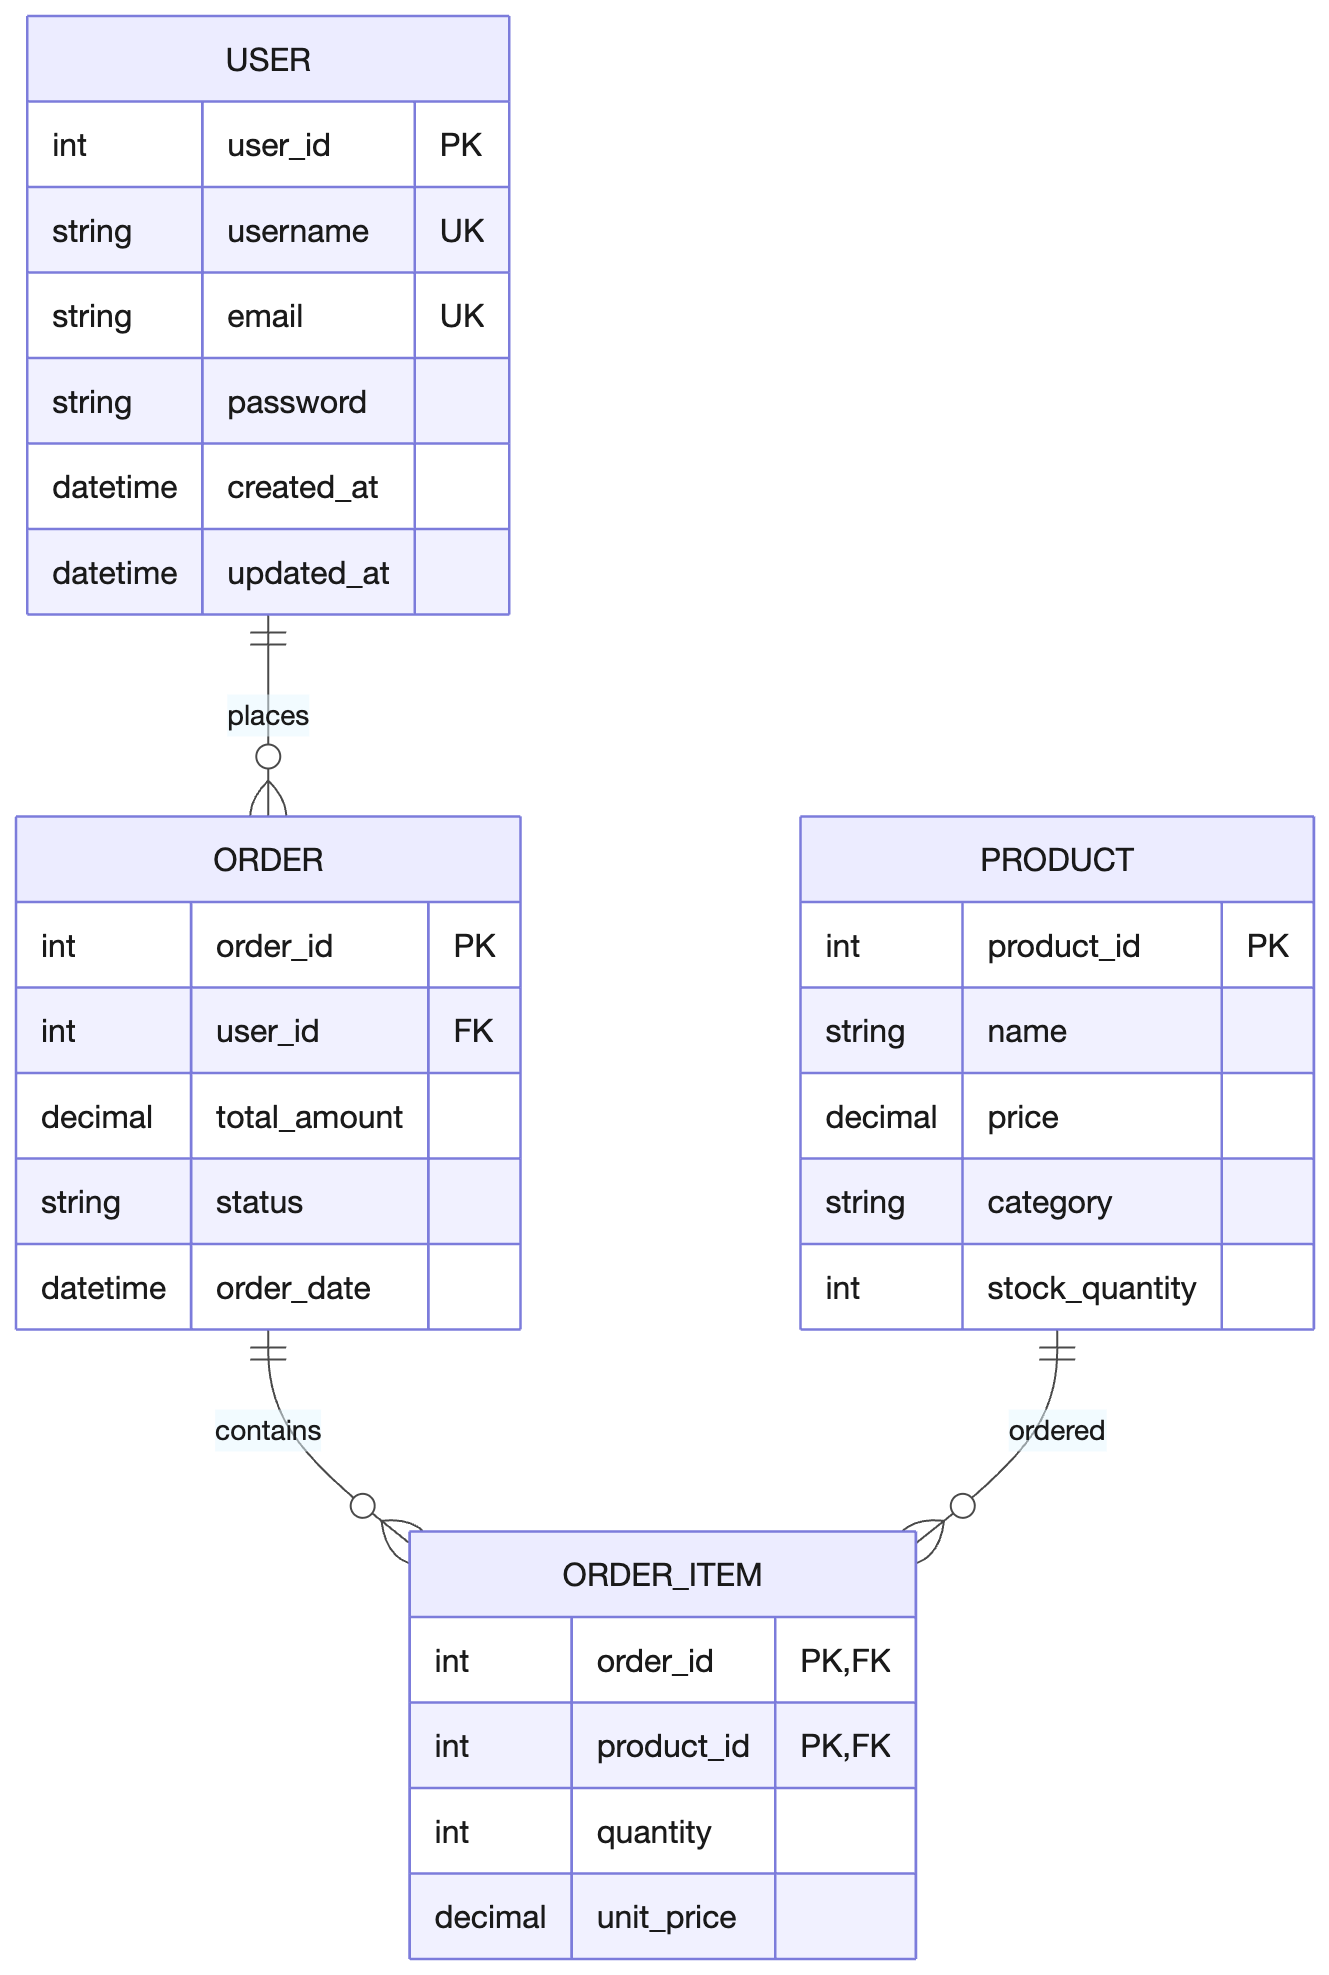
Entity Relationship Diagram
Entity relationship diagrams document database entities, attributes, and cardinality. They are ideal for explaining schema design and domain data relationships.

User Journey
User journey diagrams describe what a user does, how they feel, and which teams or systems participate. They work well for product and UX documentation.
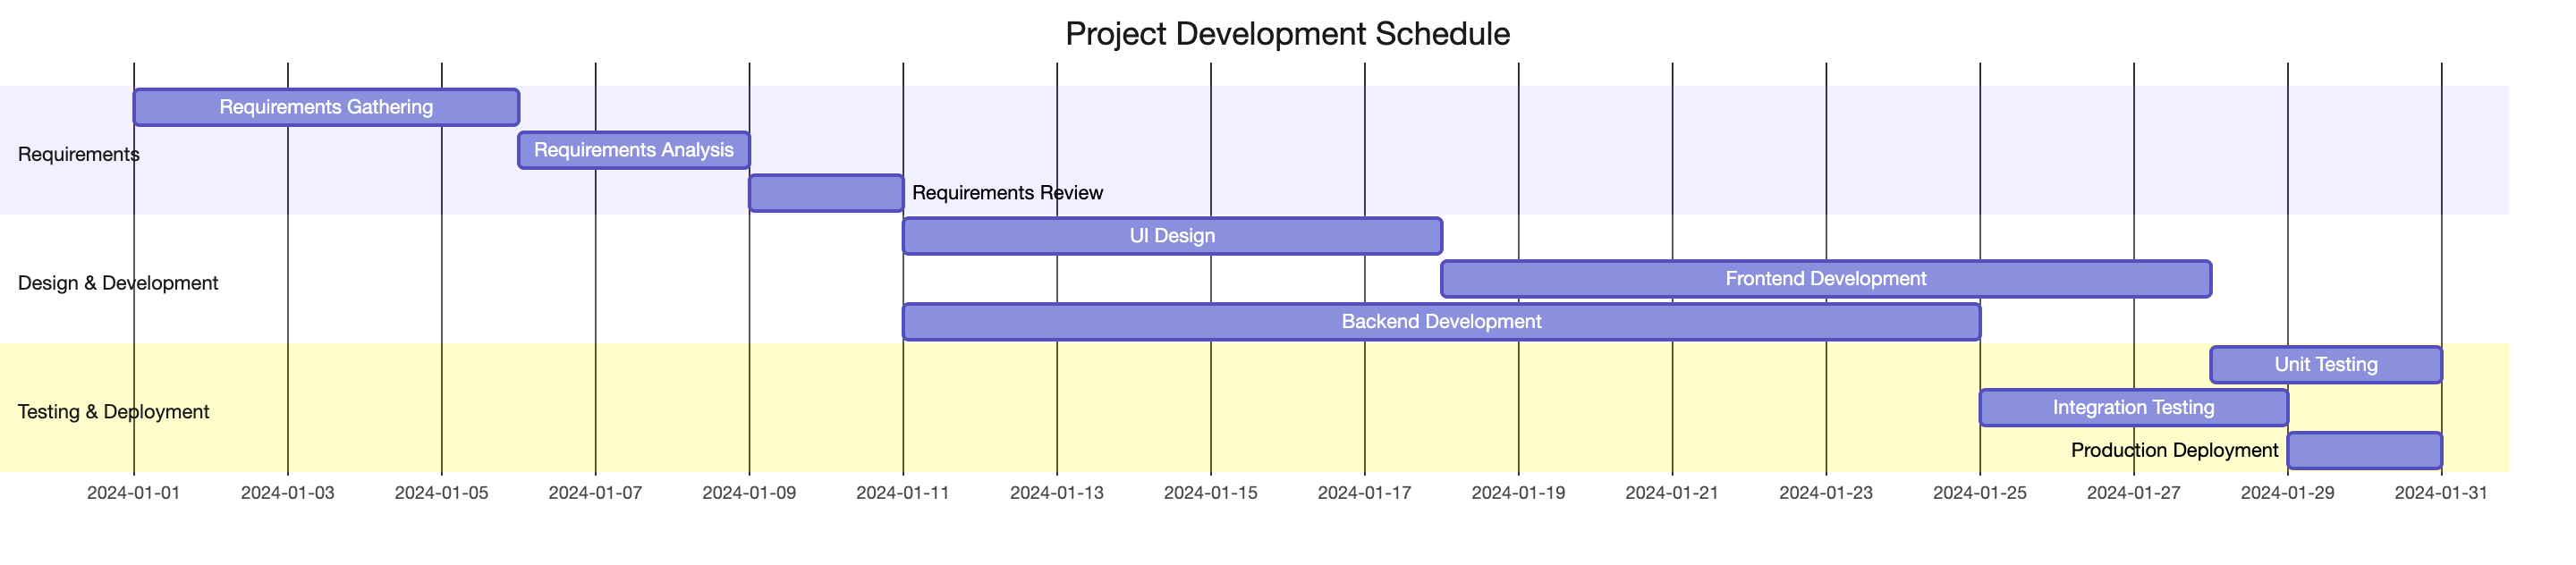
Gantt Chart
Gantt charts show schedules, task durations, dependencies, and milestones. Use them for lightweight project plans that should live close to documentation.
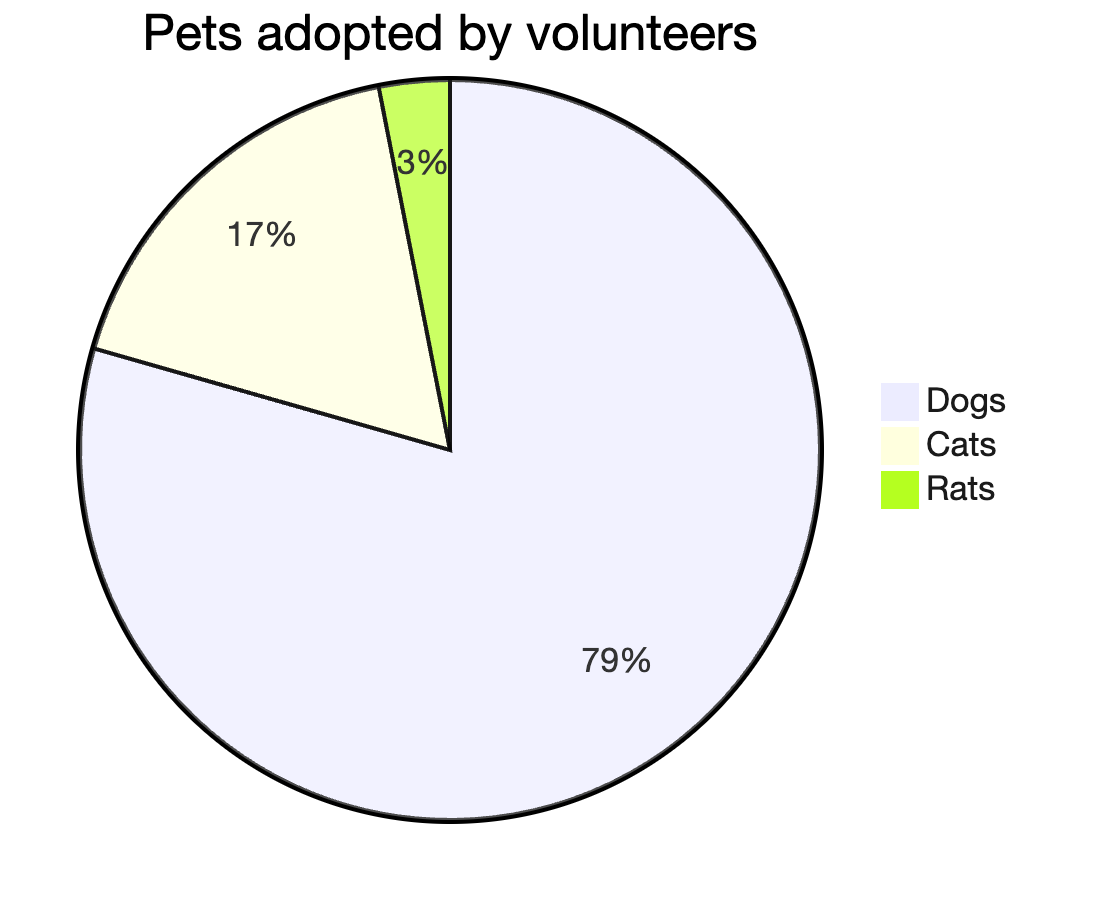
Pie Chart
Pie charts show part-to-whole relationships. Use them when a small number of categories add up to a meaningful total.
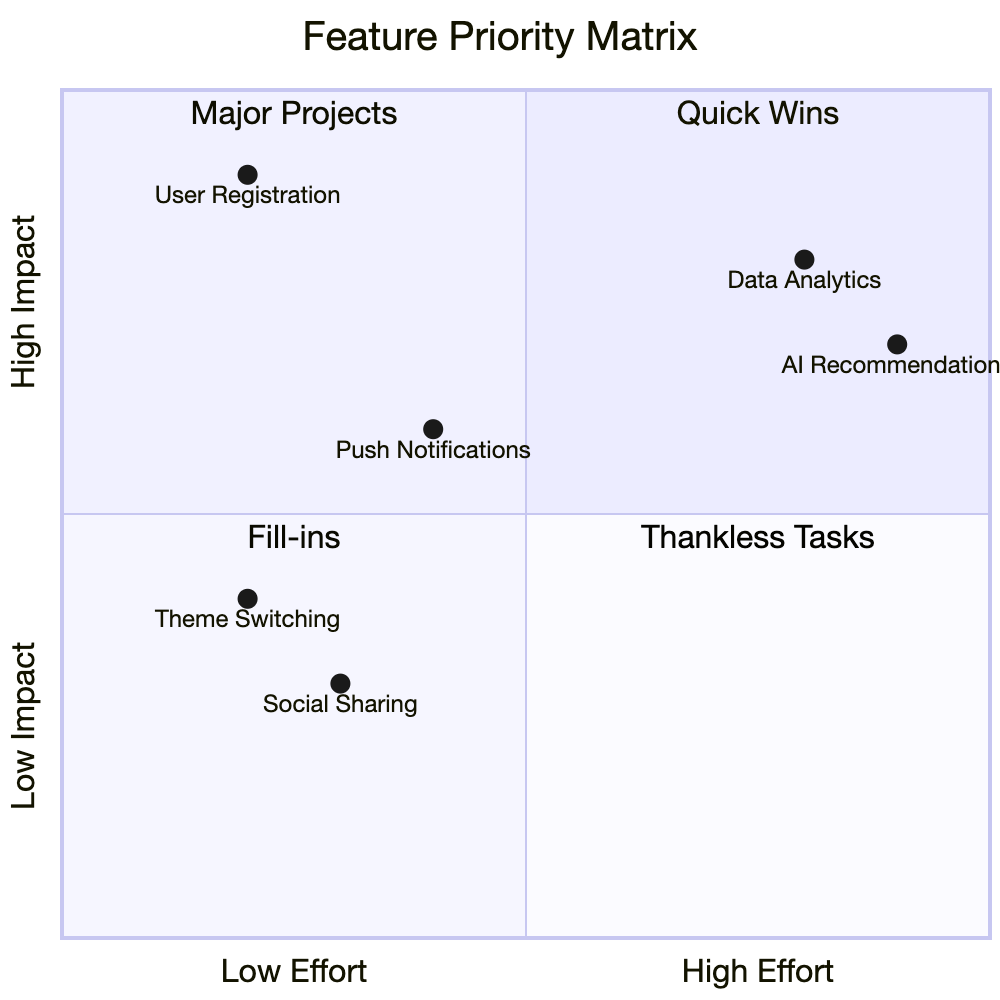
Quadrant Chart
Quadrant charts place items across two dimensions. They are useful for prioritization, positioning, and trade-off discussions.
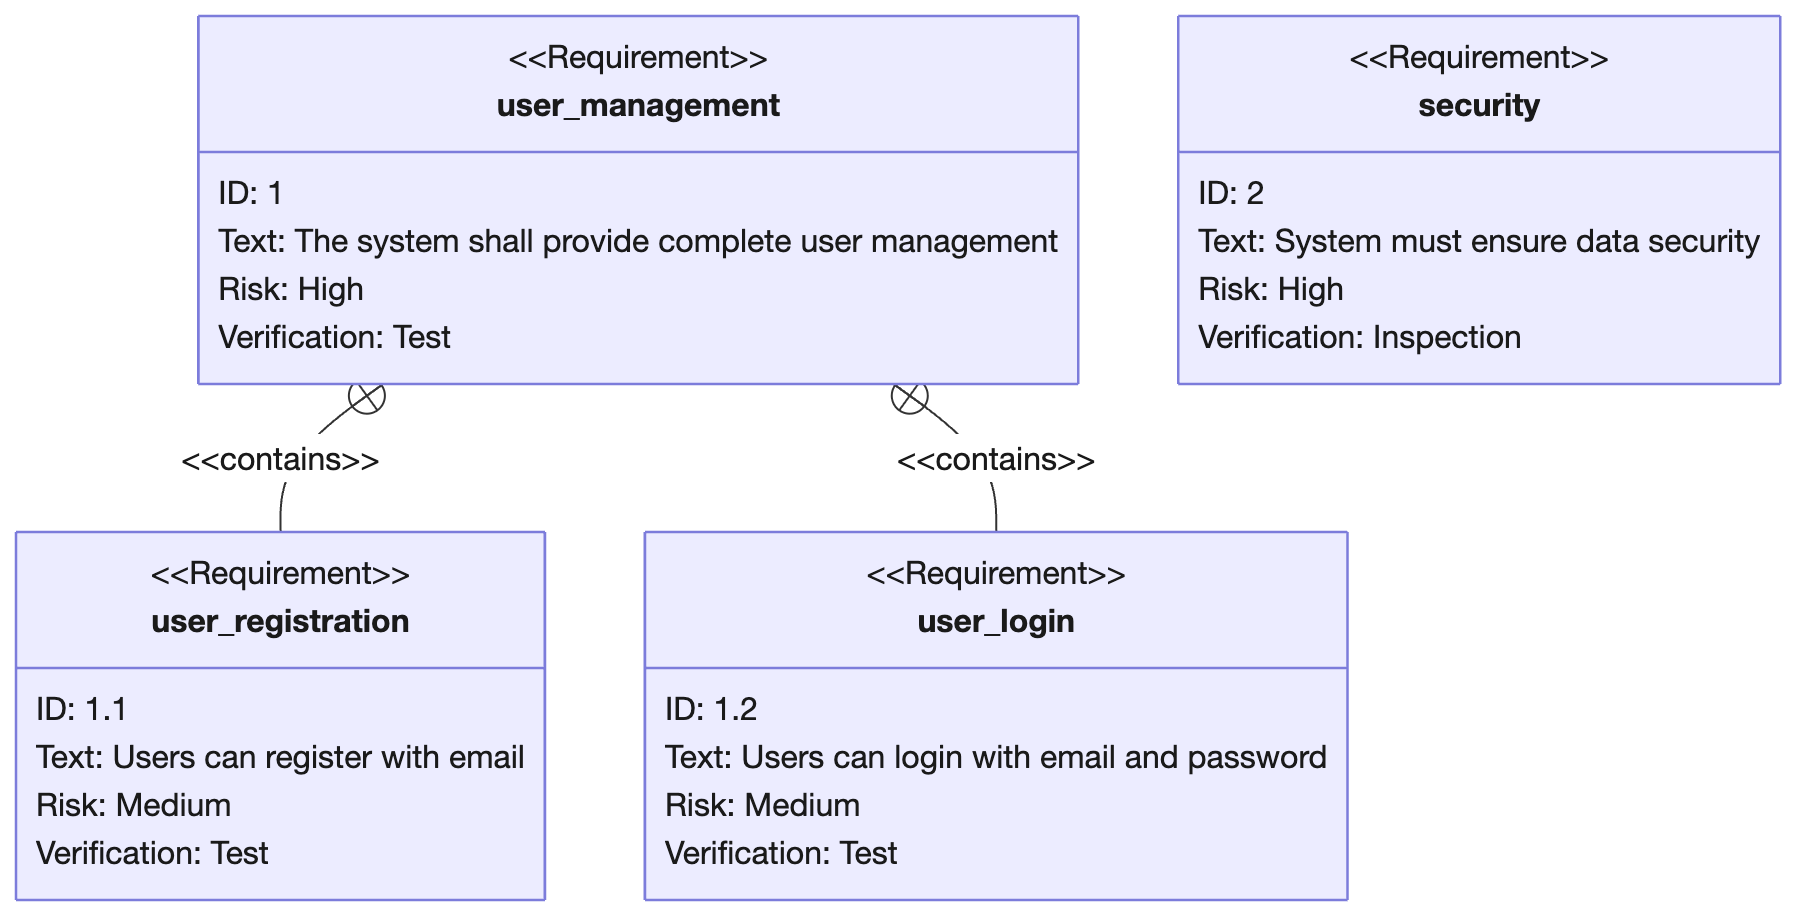
Requirement Diagram
Requirement diagrams connect requirements, elements, and relationships such as satisfies, verifies, and derives. They help teams trace why a system feature exists.
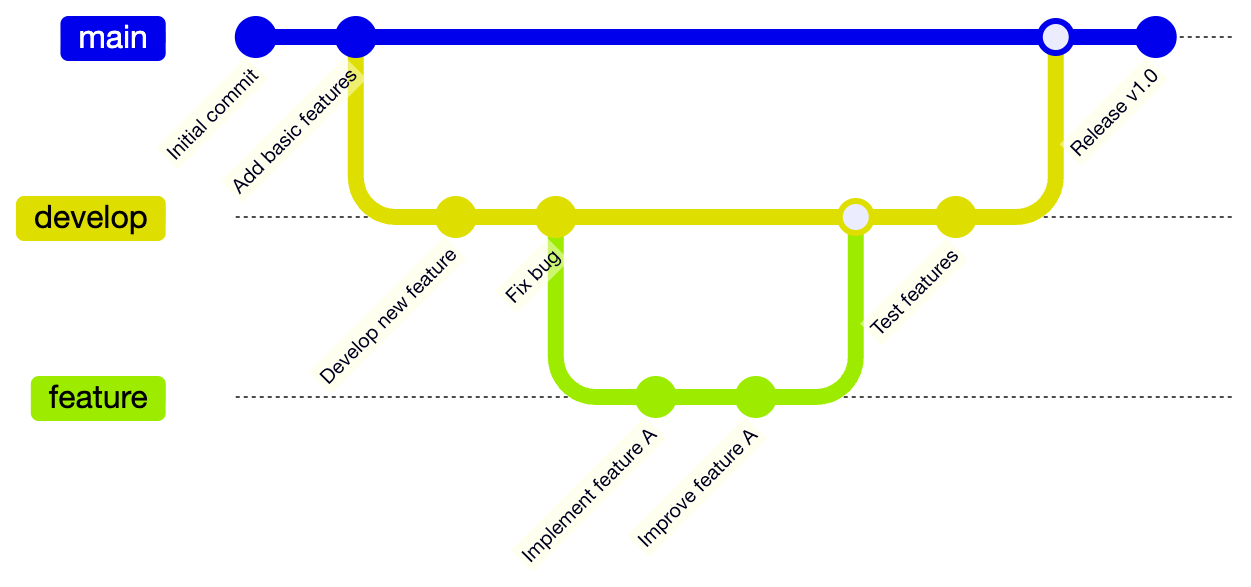
Gitgraph
Gitgraph diagrams visualize branches, commits, merges, and release flow. They are helpful for documenting Git workflows.
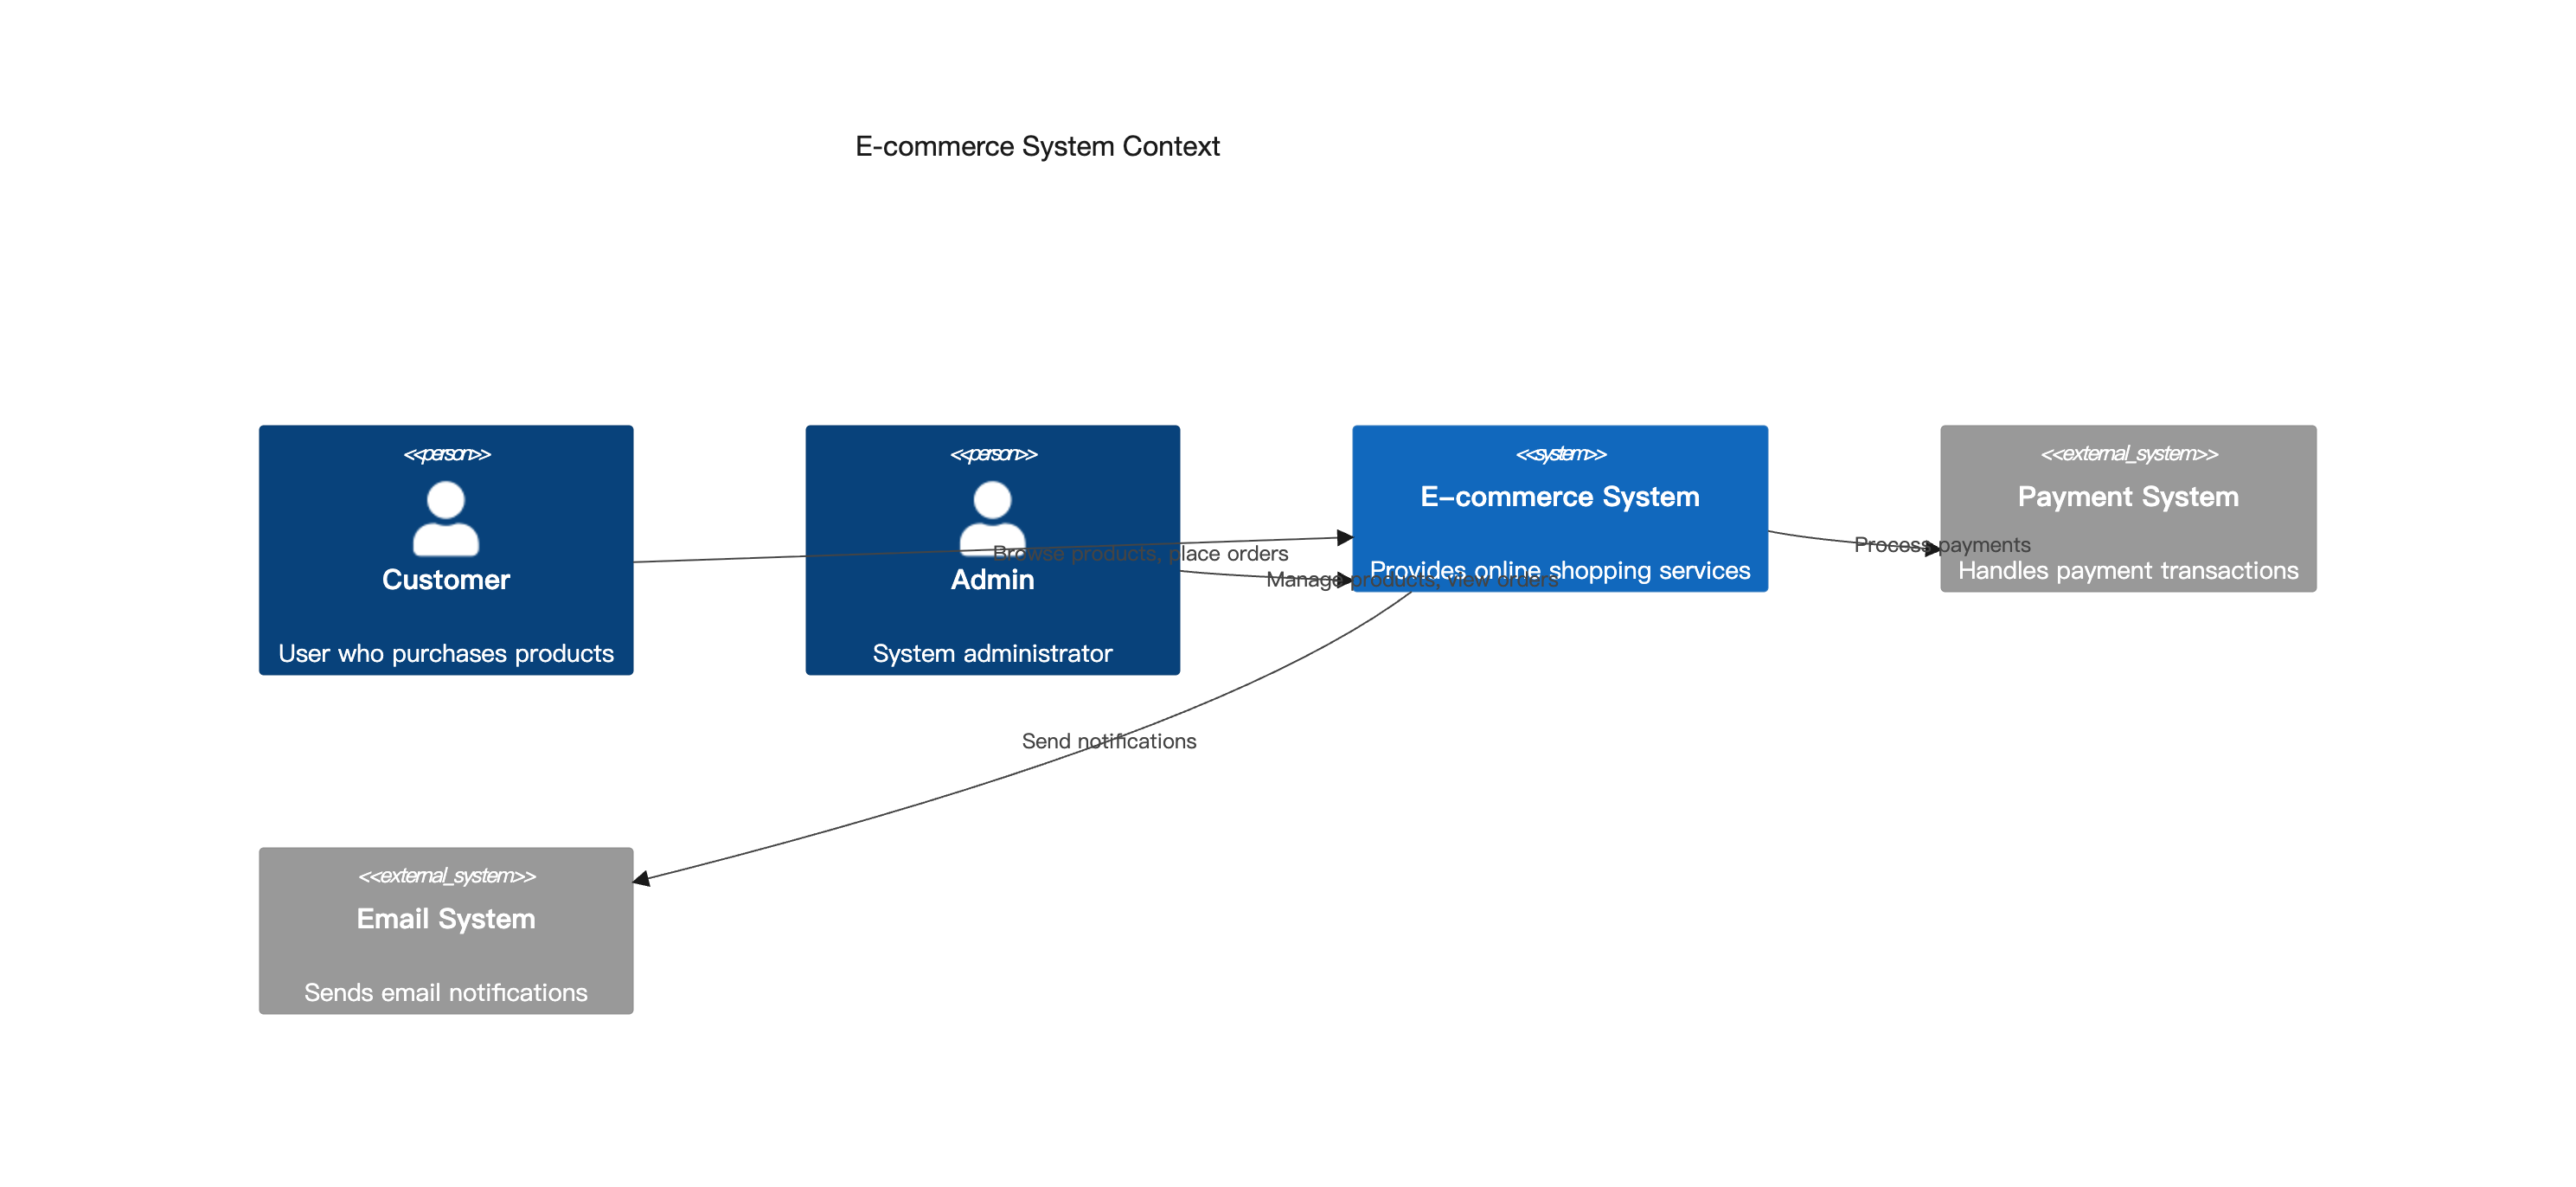
C4 Diagram
C4 diagrams describe software architecture at context, container, component, and code levels. They are useful when you need a shared architecture vocabulary.
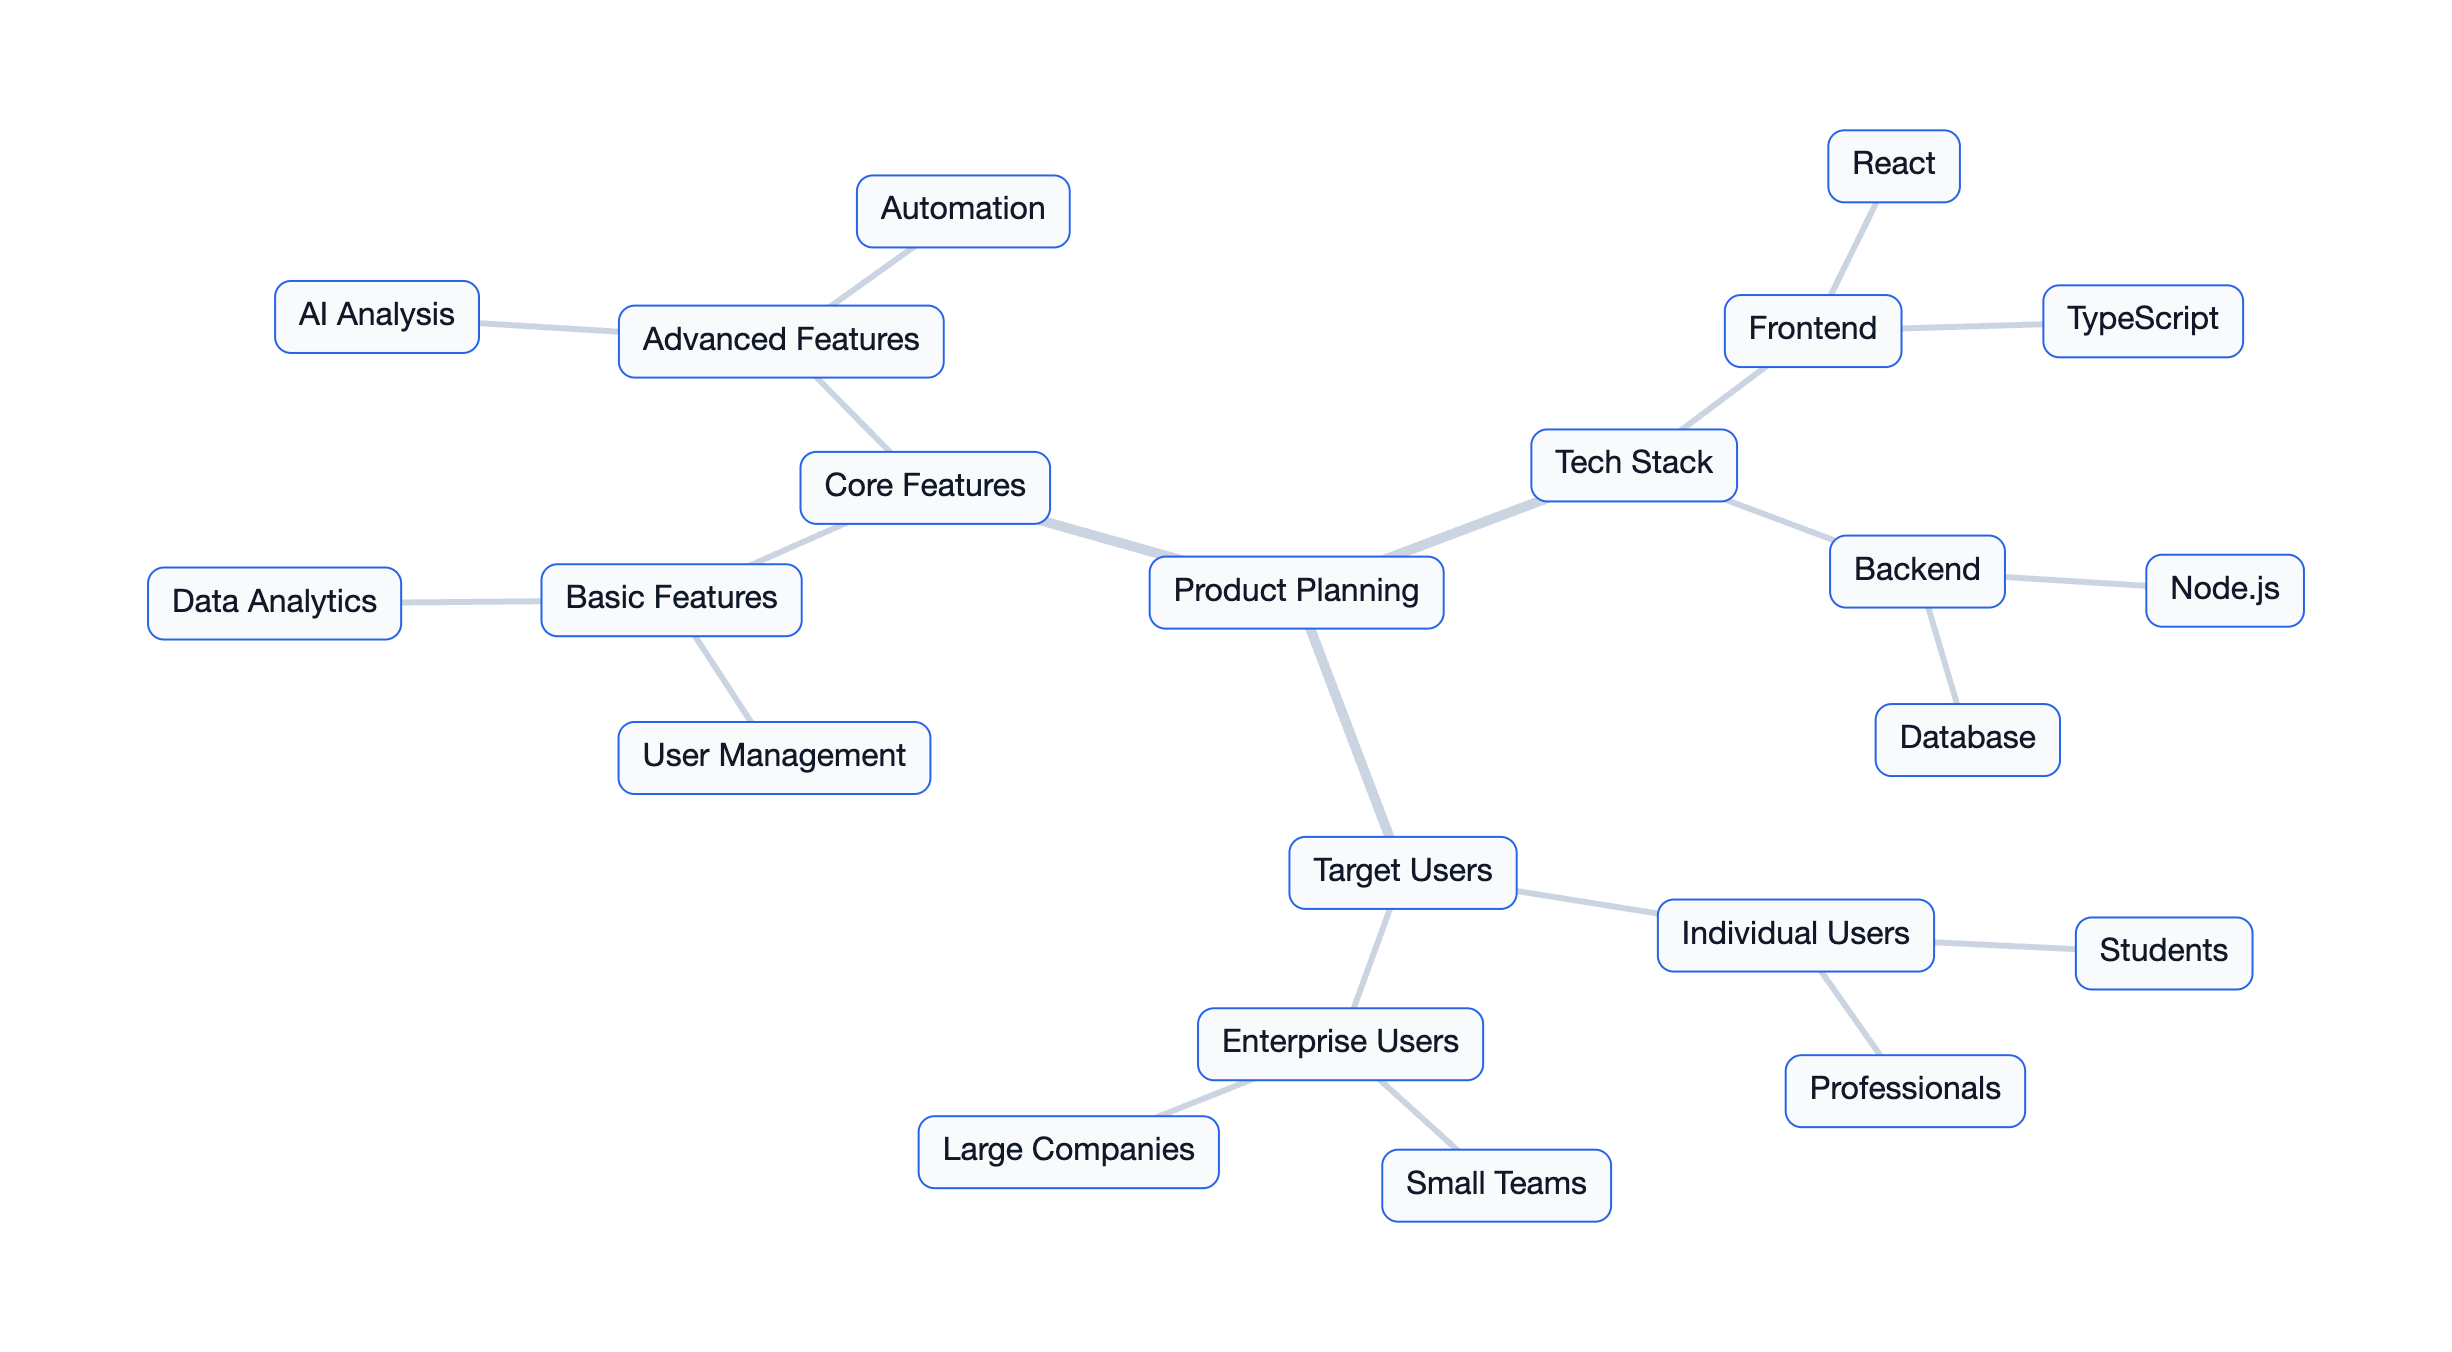
Mindmap
Mindmaps organize concepts around a central topic. They are useful for brainstorming, outlining documentation, and showing conceptual hierarchy.
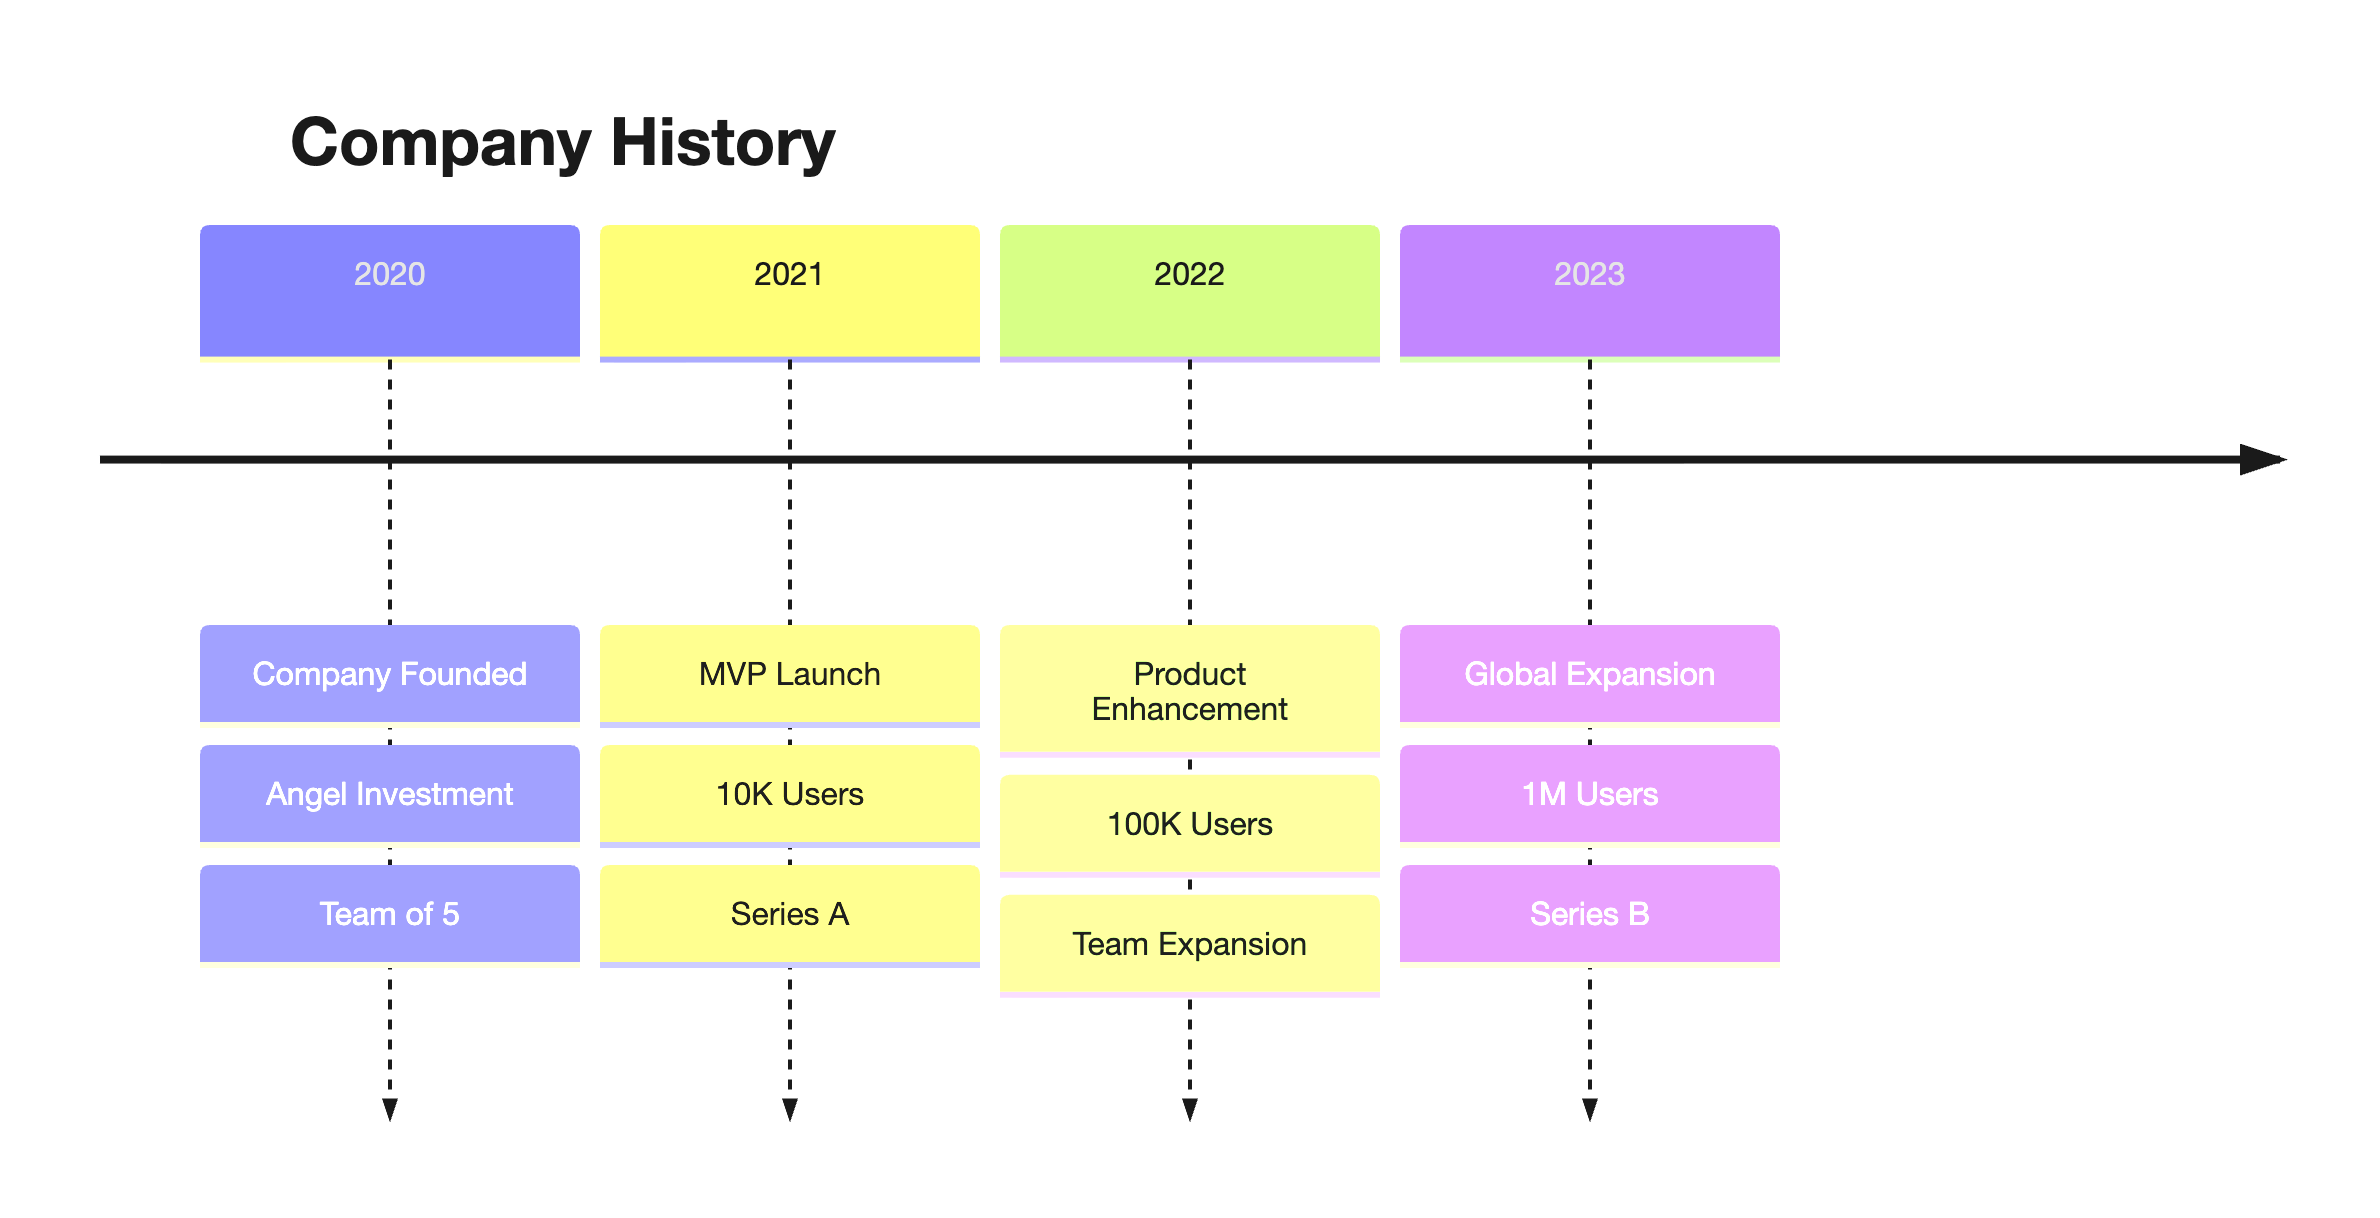
Timeline
Timeline diagrams explain events in chronological order. They work well for histories, release plans, and incident reports.
ZenUML
ZenUML is a sequence-style syntax focused on readable interaction modeling. It is useful when you want compact service collaboration diagrams.
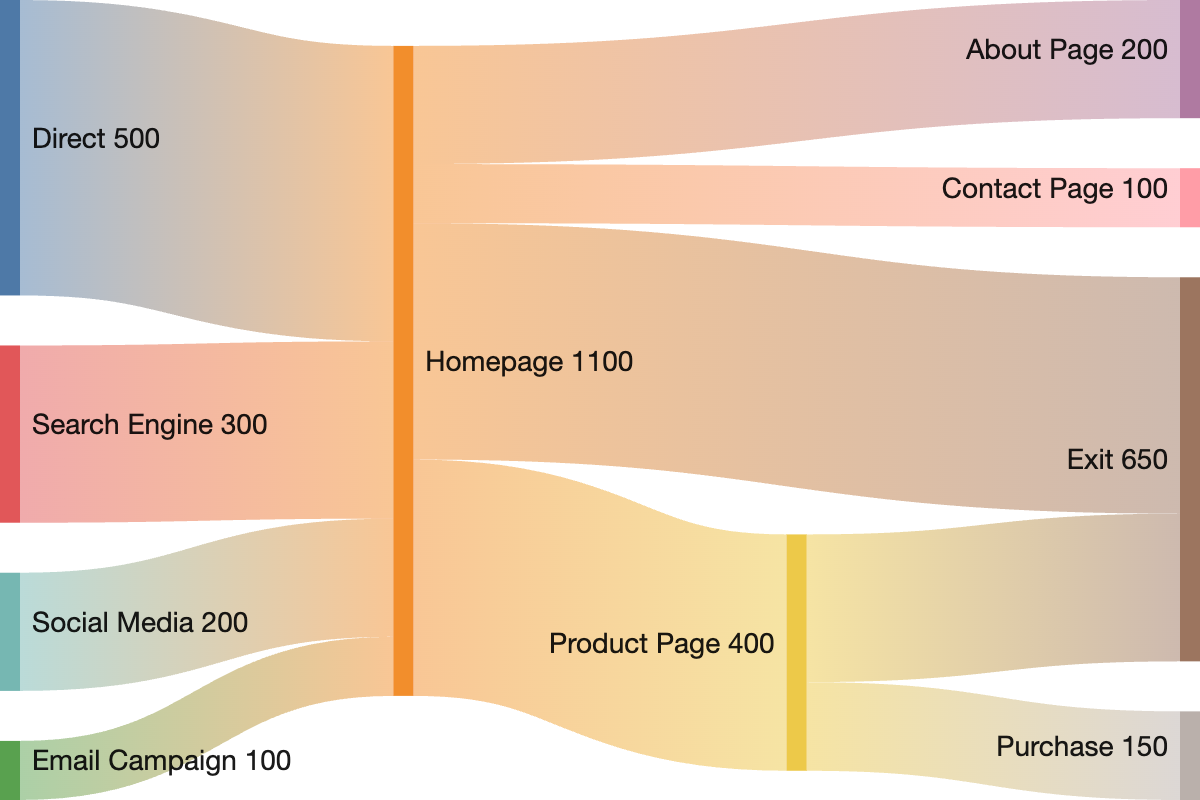
Sankey Diagram
Sankey diagrams show weighted flow from one category to another. They are ideal for energy, money, traffic, and conversion flow.
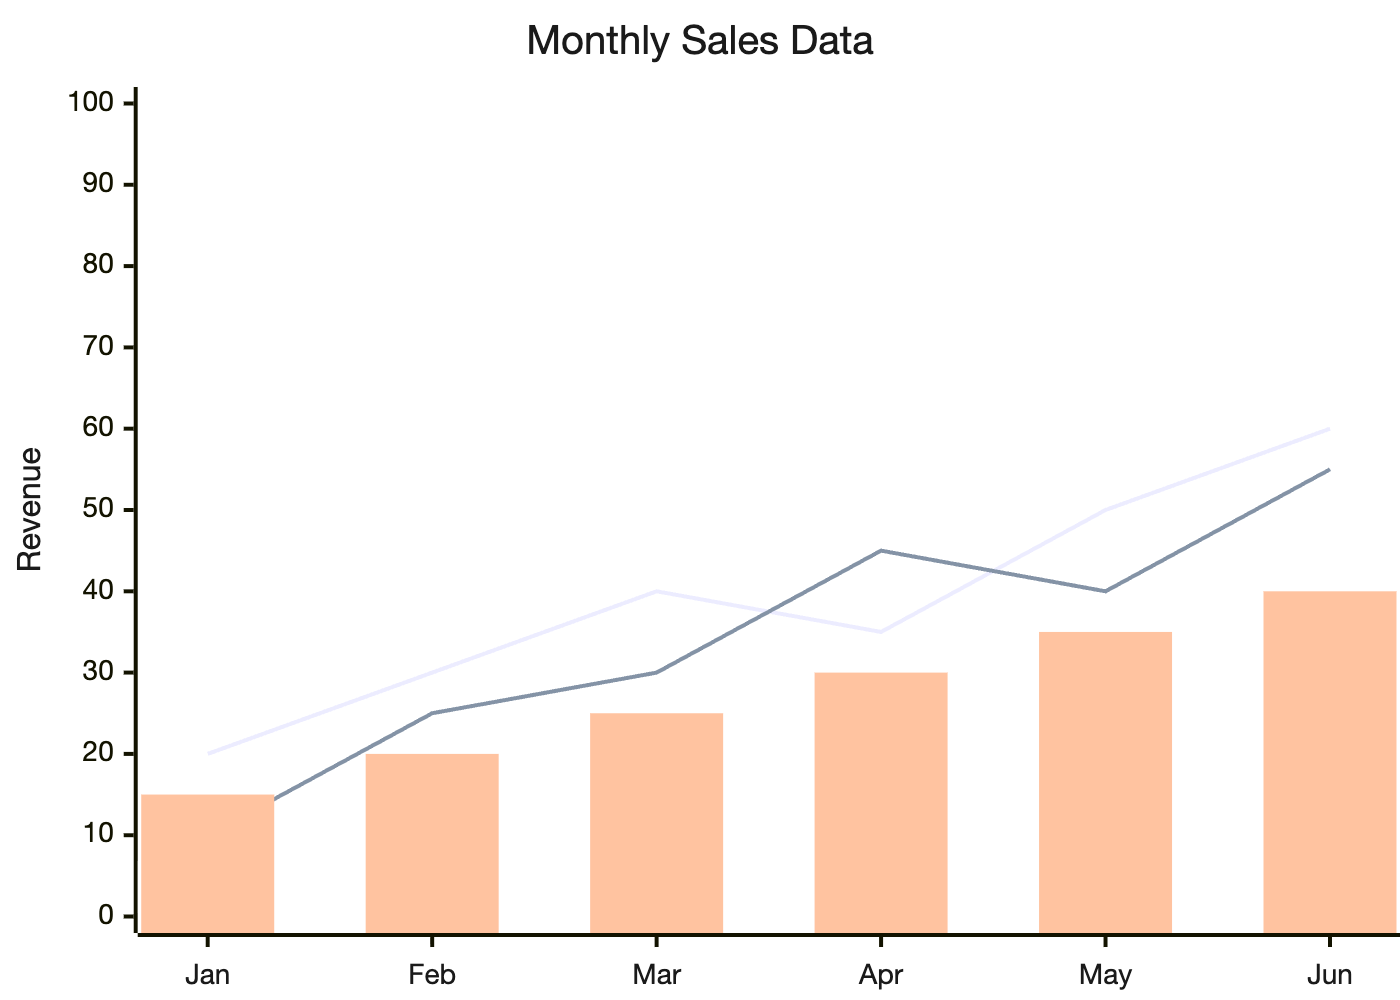
XY Chart
XY charts display data across x and y axes. Mermaid supports simple bar and line style charts for documentation-friendly metrics.
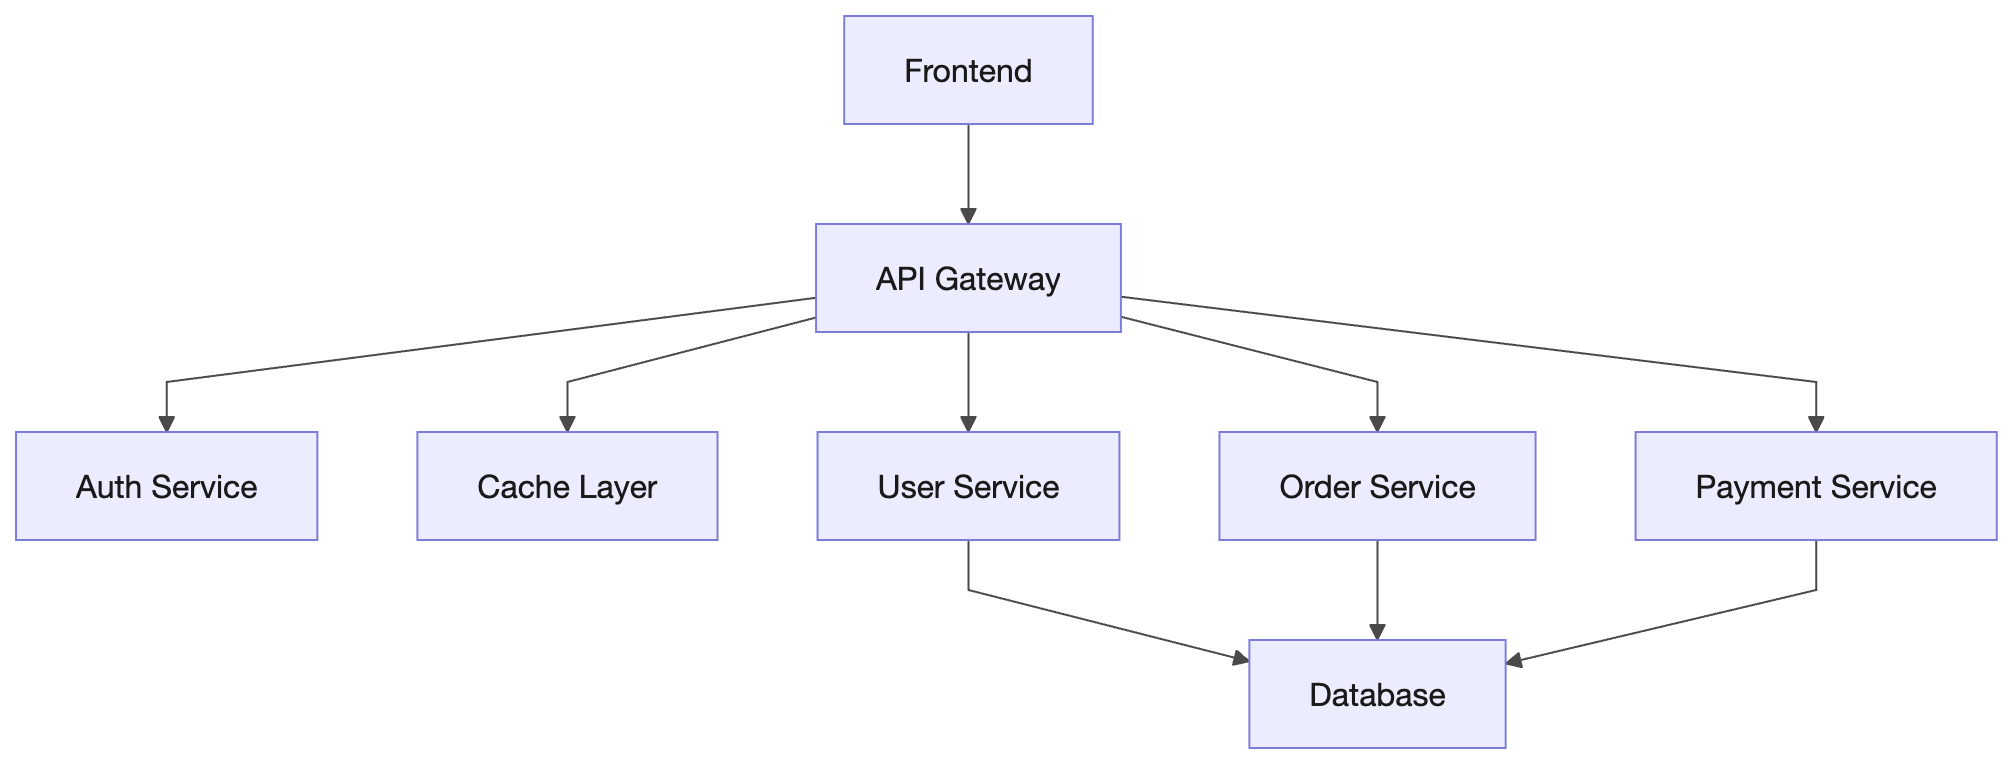
Block Diagram
Block diagrams show high-level parts and how they connect. They are useful for architecture sketches, hardware layouts, and conceptual systems.
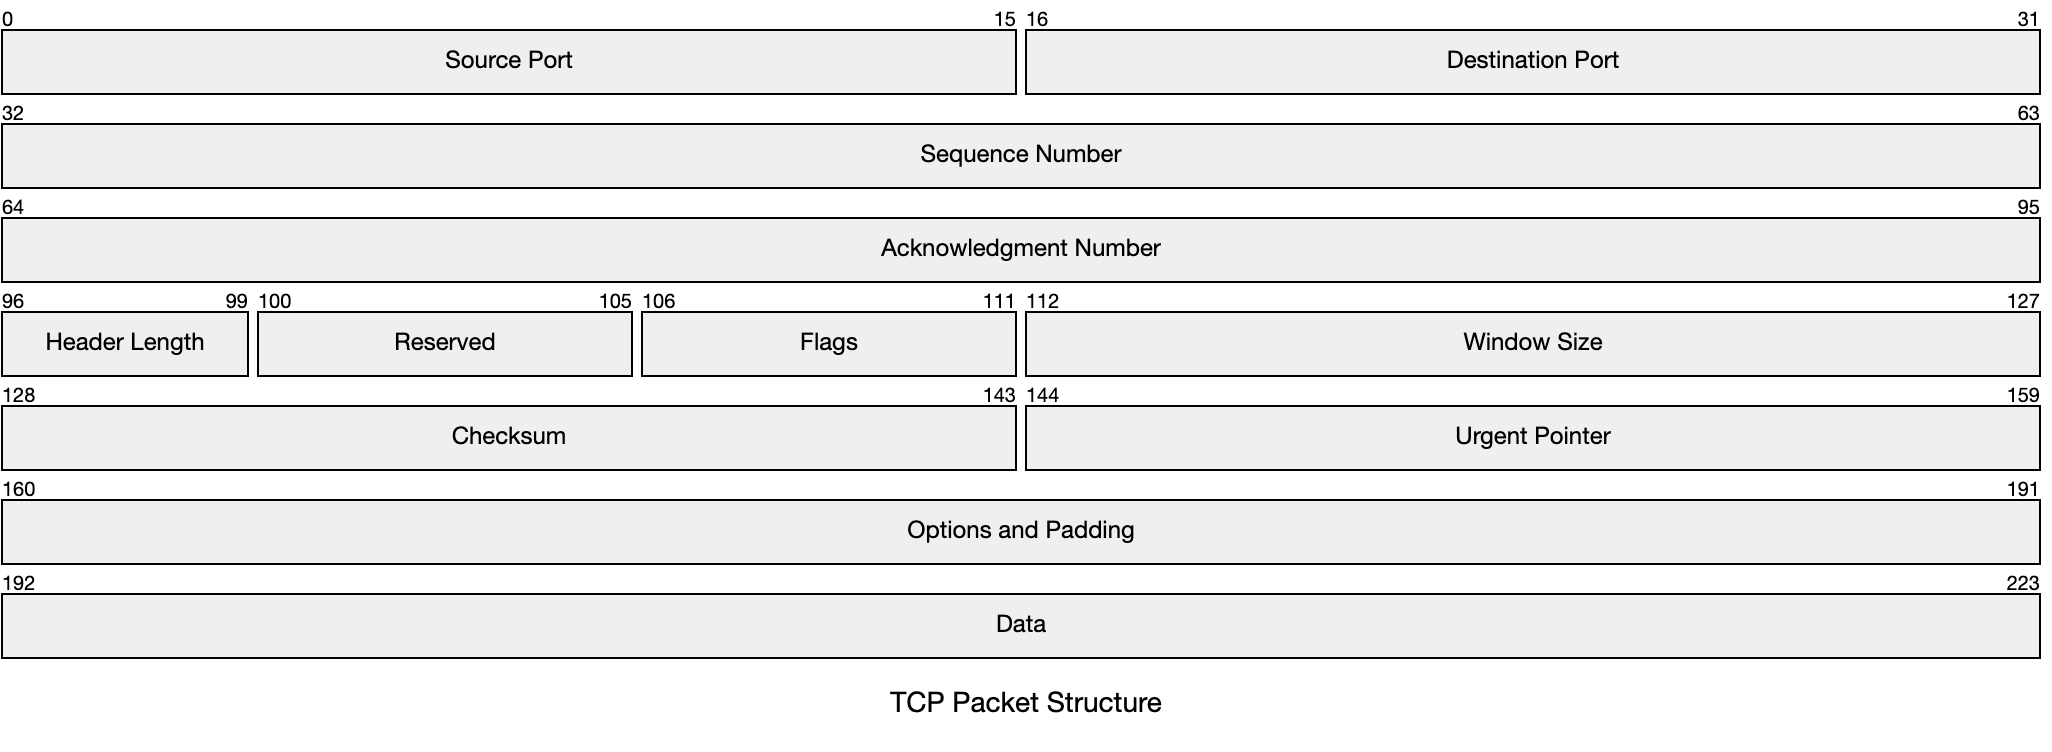
Packet Diagram
Packet diagrams document binary packet, protocol, and header layouts. They help readers understand field width and ordering.
Kanban
Kanban diagrams show work grouped by status. They are useful for lightweight planning snapshots in docs, issue reports, and project updates.
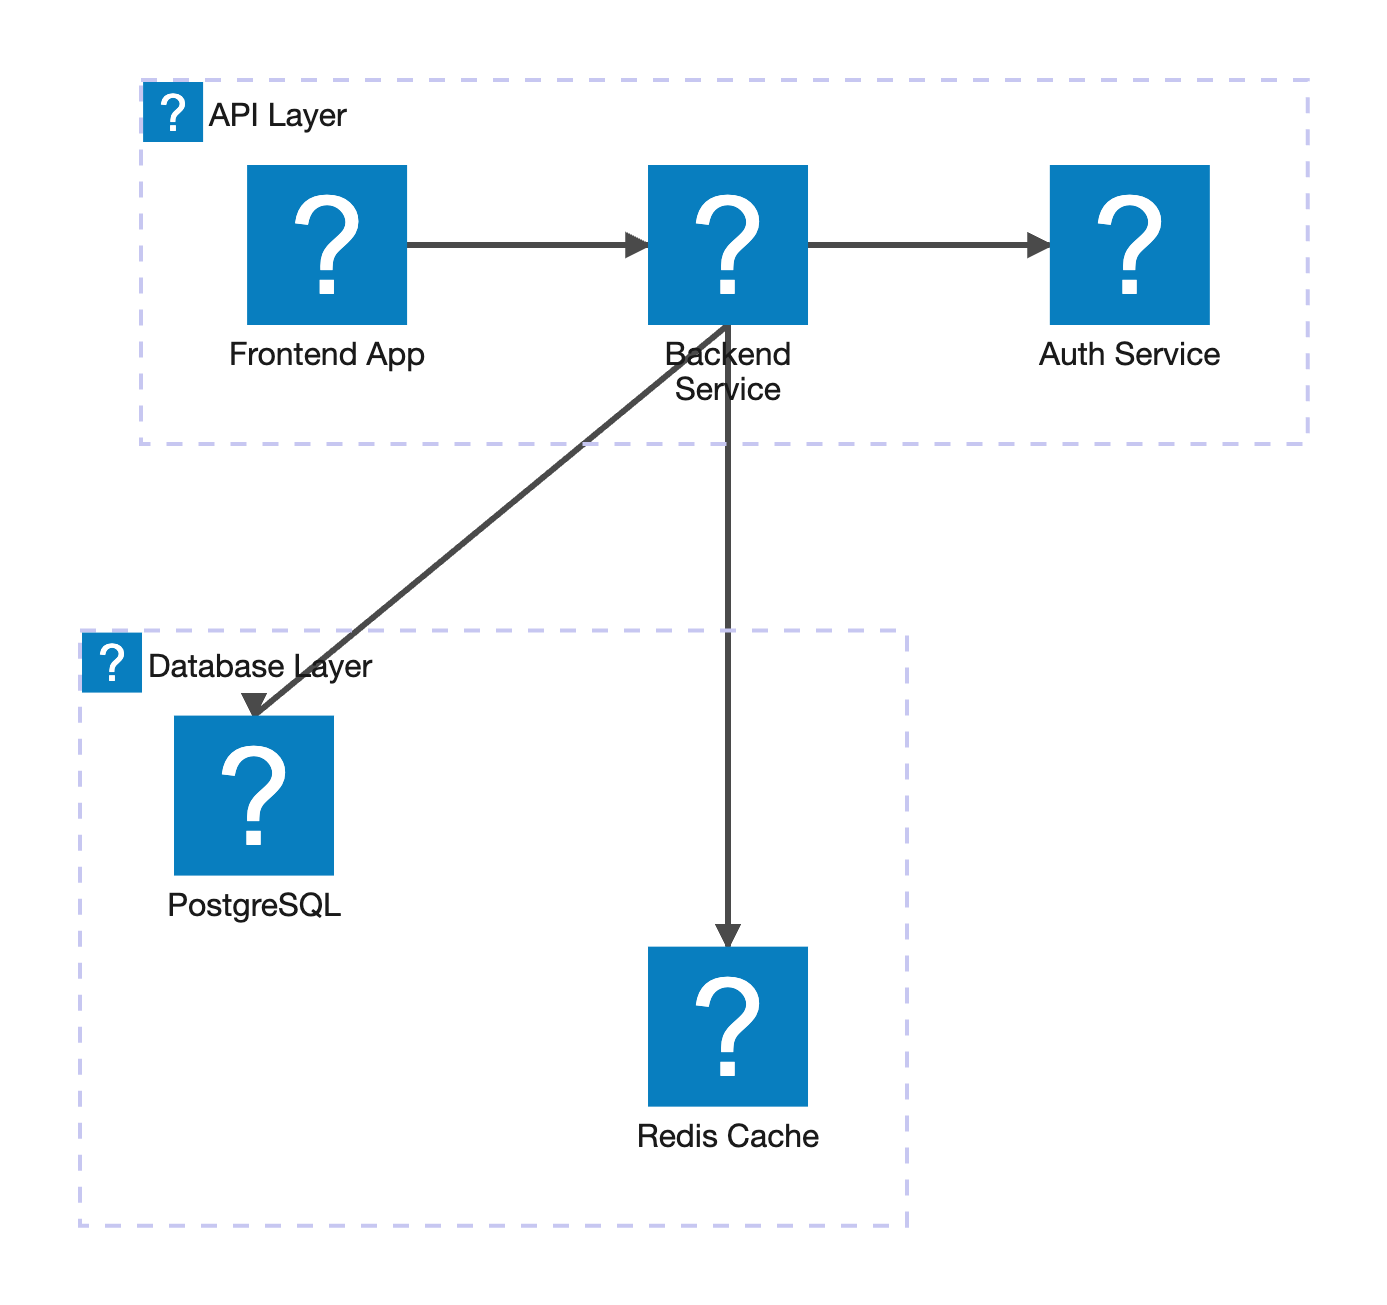
Architecture Diagram
Architecture diagrams show services, groups, and connections in a system. They are useful for infrastructure and platform overviews.
Radar Chart
Radar charts compare multiple dimensions for one or more subjects. They are useful for capability, maturity, and balanced scorecard views.
Event Modeling
Event modeling diagrams describe events, commands, views, and policies in event-driven systems. They help teams reason about behavior over time.
Treemap
Treemaps show hierarchical part-to-whole data. They are useful when categories have nested subcategories and relative size matters.
Venn Diagram
Venn diagrams show overlap between sets. They are useful for explaining shared audiences, feature coverage, or category intersections.
Ishikawa Diagram
Ishikawa diagrams, also called fishbone diagrams, organize possible causes of a problem. They are useful for root-cause analysis.
Wardley Map
Wardley maps connect user needs to capabilities and their evolution. They help with strategy, platform planning, and build-versus-buy decisions.
Cynefin Diagram
Cynefin diagrams classify situations by decision context, such as clear, complicated, complex, chaotic, and confused. They help teams choose an appropriate response.
Tree View
Tree views show hierarchical information in a compact, readable way. They are useful for file structures, taxonomies, and nested concepts.